


2017 looks like a strong upward move for the Dollar Index with a price target of 134, but after that
- Jan 11, 2017
- 3 min read
Long Term Trend
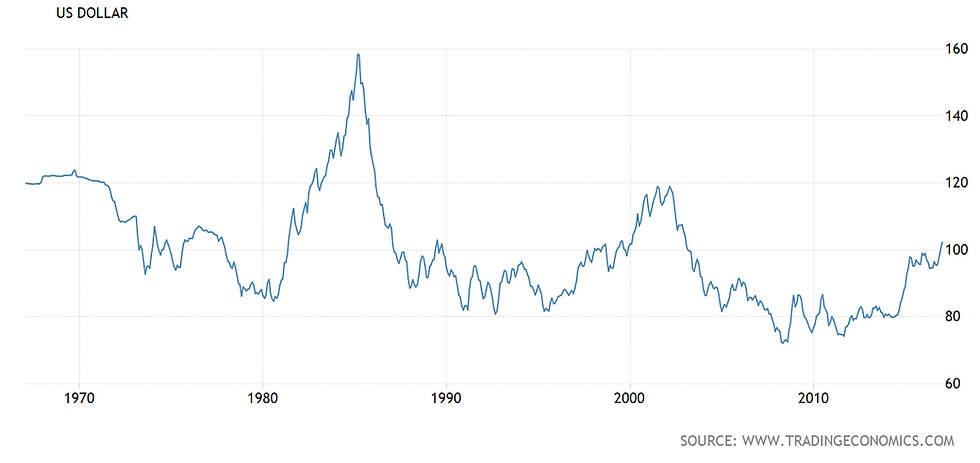
What do the long term charts say about the future value of the US Dollar? The above chart of the Dollar Index shows the value of the Dollar versus a basket of currencies (Euro 57.6%, British Pound 11.9%, Swiss Franc 3.6%, Japanese Yen 13.6%, Swedish Krona 4.2% and Canadian Dollar 9.1%) since 1967.
At first glance, the chart appears inconclusive, there are some peaks, the highest being 164.7 in February 1985, and some troughs, the lowest being 70.7 in March 2008, and since April 2011, an upward movement has developed with the index advancing past 100.
Looking at the chart a second time gives rise to the possible conclusion that the Dollar is in a long term downtrend with a series of lower lows and lower highs: the 2003 peak is lower than the 1985 peak and the 2008 low is lower than the 1995 low. As someone who believes in trading what you see, the long term downtrend conclusion is the most likely.
Pattern Recognition
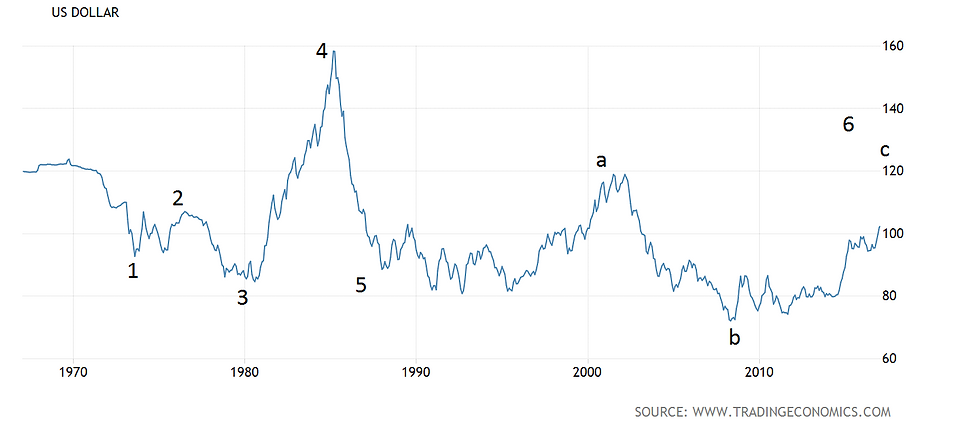
Having identified the trend, The next step, (recorded in the picture below), is to apply pattern recognition to the waves.
The move from the late 1960s to present day can be labelled as a seven wave move, with wave "6" breaking down into a more extended three wave move labelled on the diagram as "a,b,c". Wave "c" is in progress and wave "7" has yet to occur.
Fibonacci Analysis
The final step, having identified the trend and then the pattern, is to apply Fibonacci projections to anticipate, where, from the current position in January 2017, the price goes next and where the wave "c" ends. From this projected high point, the path of the final wave 7 can be forecast.
The chart below shows the length of wave "a" projected from the base of wave "b" by 1.618 to arrive at the anticipated end of wave c. The price target is 134.31.
The time taken to reach this level is not known, but assuming the rise is as fast as the upward move in 2014: late 2017 or early 2018 would be a reasonable estimate as an end point for the move.

After the top at 134
If the 134 price level is hit, it will confirm the end of wave 6 in a 7 wave movement. Wave 7 will then commence.
Importantly, at a price level of 134, the index value will not have moved significantly lower since the beginning of the down move in the 1970s. In other words, the correction will have been going on for nearly 50 years, without progressing very far. History shows that long sideways corrections result in sharp final moves down. The energy transfer at Wave 7, therefore, will be swift and powerful and comfortably take out the 2008 lows. Certainly, there will not be much time to exit positions once the move down starts: the whole move from the 130s to the 60s will probably be over in a few days. This is the conclusion from a review of the price pattern contained in the charts.
Final Thoughts
The point of this blog is to show that the picture alone tells the story, and that everything that occurs in the financial markets is simply cause and effect which can be understood through the lens of 3 and 7 wave movements.
It is worth reflecting, however, on the many "news related" reasons why the dollar could rise rapidly in 2017, and then subsequently crash spectacularly to reach new lows. The rise could be driven by monetary policy divergence between the US and the rest of the Dollar Index countries; anticipation of a reduced trade deficit in the US through onshoring more jobs; and benign price movements in the US equity and debt markets.
Speculating on the potential reasons for a crash is more intriguing. As the dollar continues to rise there is a risk of any of the following happening in isolation or combination to reverse the move.
- President Trump announces that US debt levels are unsustainable: the US takes a 20% haircut on all treasury bond debt instruments
- In anticipation of the above debt haircut, and or because of capital flight from the Yuan, the Chinese sell a large portion of their inventory of US Treasuries, immediately crashing the US debt market and sending the dollar downward.
- President Trump denounces the Federal Reserve for implementing policies that inflate the dollar and undermine American competitiveness. Federal Reserve independence is cancelled with future policy to be set by the Executive. Interest rates are immediately reset to zero.
Copyright James Tuffin, 2017
Comments